The following is a growing database of charts that demonstrate that limiting the Federal Reserve is an economic imperative. We’re always seeking new information to share with the public; please contact us if you come across something you believe should be shared.
CLICK TO ENLARGE IMAGES
Loss of American Middle Class Jobs
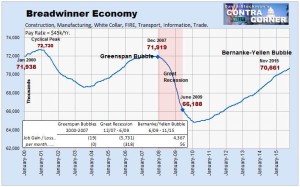
Despite a population increase of over 40 million since the beginning of the Fed’s bubble/burst economic paradigm in the late 1990s, there are nearly 2 million FEWER jobs in this country that pay $45k or more.
Growing Periods of Time Between U.S. Bubble Bursts and Jobs Recovery
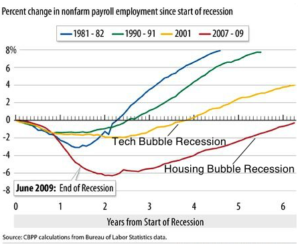
The amount of time between recessions and recoveries of the job market has been growing during the Fed’s bubble/burst economic paradigm. Historically, the market recovered quickly in the wake of recessions. However, it took the job market 4 years to recover following the bursting of the late-90s tech bubble, and it’s taken the market more than 6 years to recover from the bursting of the mid-2000s housing bubble. Note that “recovery” of the job market is defined as the aggregate number of persons employed returning to its pre-recession peak. That definition doesn’t take into consideration population increases or quality of jobs created.
U.S. Total Unemployment Rate Worst since Great Depression
The Bureau of Labor Statistics’s broadest measure of unemployment, the U-6 Rate, which includes underemployed and “marginally attached” workers, has been increasing during the Fed’s bubble/burst economic paradigm. As with other measurements of unemployment, the U-6 Rate has, since the late 1990s, yielded higher-highs and higher-lows with each cycle. It’s important to note that Gallup has been consistently reporting its broadest measure of employment between 2 and 4 percentage points higher than the BLS since the latter changed its methodology during the 1990s.
U.S. Exponential Money Printing
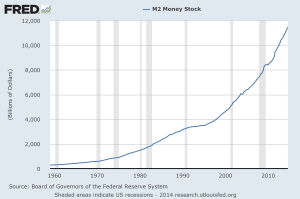
Since the U.S. abandoned the gold standard and adopted fiat currency in 1971, the Fed has been free to expand the money supply (“print”) without restraint. Since this time, the Fed has printed exponentially, yielding tremendous asset price bubbles (tech bubble, housing bubble, etc.) that have burst and crashed the economy.
Fed Inflating U.S. Stock Bubble
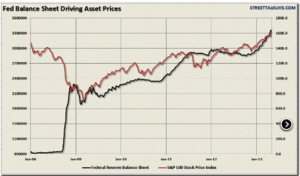
The historically-positive performance of stocks since the Great Recession despite a weak economy has been a function of the Fed’s liquidity pumping. Notice how the stock market was in free-fall until the Fed intervened after the financial crisis. The market has since correlated nearly perfectly with subsequent increases and decreases on the Fed’s books. This is precisely the bubble pattern we saw in the years leading up to the bursting of the Tech Bubble and the Housing Bubble, two events which led to widespread long-term unemployment and underemployment.
Fed Inflating U.S. Stock Bubble: A Closer Look
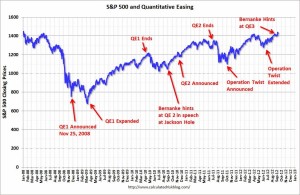
Since the financial crisis, the Fed has been promoting a tremendous stock bubble. As this chart demonstrates, the market’s performance has been largely based on the injection of $4 trillion in newly-printed dollars, not market fundamentals or a strong underlying economy.
U.S. Stock Market Growing While Labor Market Declining
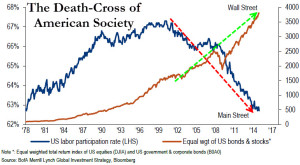
During the Fed’s bubble/burst economic paradigm since the late 1990s, growth of the equities and bonds markets and growth of the labor market have been inversely proportional.
Stock Bubble and Concurrent Job Market Bust
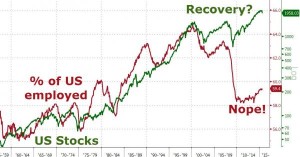
Seven years of zero interest rates and trillions upon trillions of printed dollars have created a massive equities bubble on Wall Street. The Main Street job market, on the other hand, has languished.
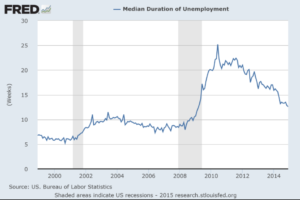
U.S. Median Duration of Unemployment Growing
The median duration of joblessness has been increasing during the Fed’s bubble/burst economic paradigm, with higher-highs and higher-lows with each cycle.
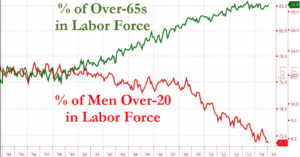
More Seniors and Fewer People of Prime Working Age in U.S. Labor Force
During the Fed’s bubble/burst economic paradigm since the late 1990s, seniors have had to postpone retirement while people of prime working age–especially men–have experienced difficulties entering and/or remaining in the labor force. (Source: Bloomberg)
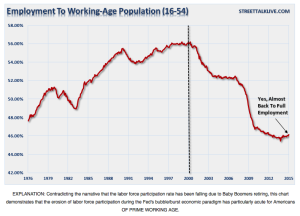
Labor Force Participation Eroding for Americans OF PRIME WORKING AGE
Contradicting the narrative that the labor force participation rate has been falling due to Baby Boomers retiring, this chart demonstrates that the erosion of labor force participation during the Fed’s bubble/burst economic paradigm has particularly acute for Americans OF PRIME WORKING AGE.
U.S. Part-Time For Economic Reasons Growing
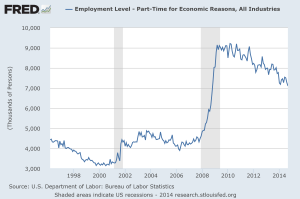
Underemployment, as defined as part-time workers who wish to work full-time but can’t for economic reasons, has been on the rise during the Fed’s bubble/burst economic paradigm. Note that this definition of underemployment doesn’t include full-time employees who, due to economic reasons, work below their capabilities or salary potential. Note the higher-highs and higher-lows with each cycle.
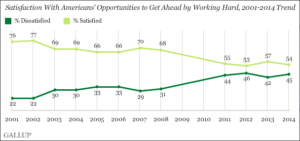
Americans’ Belief that Hard Work Yields Financial Success Declining
The erosion of the job market during the Fed’s bubble/burst economic paradigm has convinced more Americans that the American Dream is unattainable.
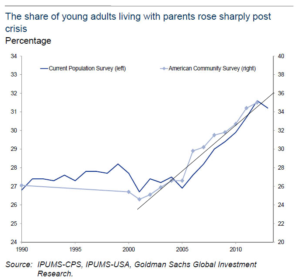
Growth of Young Americans Living with Parents
According to the U.S. Census Bureau, the percentage of Americans ages 18-31 living with their parents has risen sharply during the Fed’s bubble/burst economic paradigm. It’s important to note that the Census’s American Community Survey, which shows greater growth (from 25% to 35%), is conducted online, while its Current Population Survey, FROM WHICH THE OFFICIAL UNEMPLOYMENT RATE IS DERIVED, and shows more modest–but still significant–growth (from 27% to 31%), is conducted by personal interview only. It’s been hypothesized that the Current Population Survey under-counts negative economic data because adults who are undergoing financial distress (such as being unemployed and/or living with their parents) are less likely to disclose that fact to a stranger.
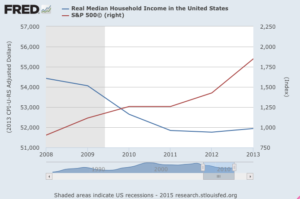
U.S. Stocks Double While Median Income Declining
Due to more than $4 in money printing since the 2008 Financial Crisis, the S&P 500 has nearly doubled while median incomes (adjusted for inflation) have fallen.
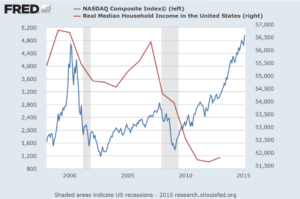
Median Income Falls While Nasdaq Explodes
During the Fed’s bubble/burst economic paradigm since the 1990s, median household income has fallen while the Nasdaq has reached record highs.
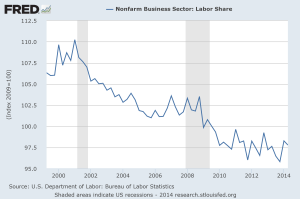
U.S. Non-Farm Private Sector Employment Falling
After decades of robust growth, the private sector’s share of the labor market has been in decline during the Fed’s bubble/burst economic paradigm.
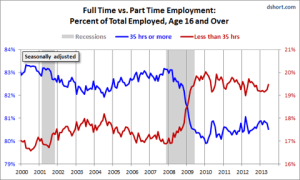
U.S. Full-Time Employment Shrinking While Part-Time Employment Growing
Bucking a historical trend that held true even during past recessions, the growth of part-time jobs has outpaced growth of full-time jobs during the Fed’s bubble/burst economic paradigm, inverting during the Great Recession.
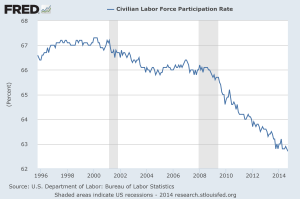
U.S. Labor Force Participation Rate Falling
The labor force participation rate has been falling steadily during the Fed’s bubble/burst economic paradigm. It recently reached levels not seen since the 1970s, when many American households had but one breadwinner. Today, it’s common–often necessary–for both spouses to work. Much of the recent decline in the unemployment and underemployment rates can be attributed to a reduction of the labor force participation rate.
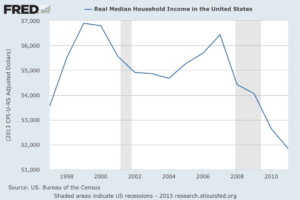
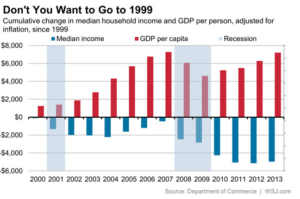
Real U.S. Household Median Income Falling
Real household income (adjusted for inflation) has been declining during the Fed’s bubble/burst economic paradigm. Today, the average American household is netting less than it did 20 years ago.
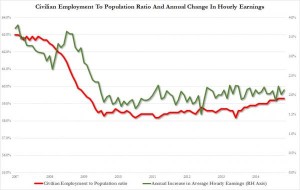
Depressed Job Market and Depressed Wages
Despite seven years of zero interest rates and trillions upon trillions of printed dollars, both the labor force participation rate and average wages remain depressed.
Real U.S. Household Median Income Falling: A Closer Look
Although the average person’s real (adjusted for inflation) earnings have been decreasing during the Fed’s bubble/burst economic paradigm, GDP has continued to increase. This is because 1) the Fed has been enabling an increasing amount of deficit spending on the part of the federal government, and 2) the wealthy have been earning more and contributing a larger share of GDP.
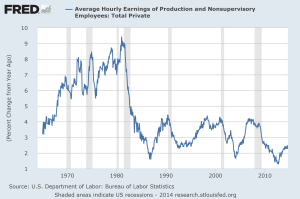
U.S. Average Wages Floundering
After decades of robust growth following the Great Depression, U.S. average wages have been stagnant during the Fed’s bubble/burst economic paradigm.
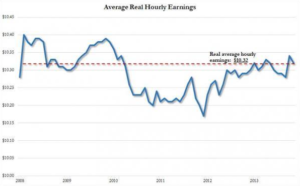
U.S. Average Real Hourly Wages Floundering: A Closer Look
For those lucky enough to have kept their jobs since the Fed’s housing bubble popped, real wages (adjusted for inflation) have been stagnant. (Source: Bloomberg)
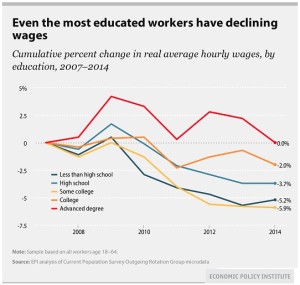
Wages Declining for Workers of All Income Levels
During a period in which the Fed has facilitated the doubling of the stock market via more than $4 trillion of money printing, wages have fallen for workers OF ALL EDUCATION LEVELS. Millions of these workers, the long-term UNDERemployed, went through long periods of UNemployment before securing less lucrative employment.
Fed-Fueled Income Inequality Visualized
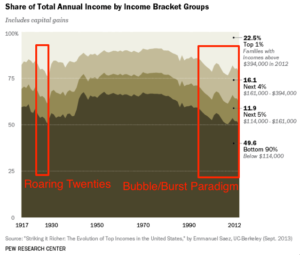
The housing market has suffered tremendous price swings during the Fed’s post-1990s bubble/burst economic paradigm. The enormous bubbles in housing prices are an excellent example of how the Fed has been preventing the free market from clearing itself of malinvestment. By pumping massive amounts of liquidity in the wake of its post-bubble recessions, our central bank has been preventing prices to return to normal, thereby perpetuating (and exacerbating) the destructive cycles of bubbles and economy-crashing bursts.
The Fed’s Ongoing Housing Bubble Visualized
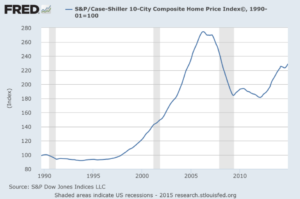
The housing market has suffered tremendous price swings during the Fed’s post-1990s bubble/burst economic paradigm. The enormous bubbles in housing prices are an excellent example of how the Fed has been preventing the free market from clearing itself of malinvestment. By pumping massive amounts of liquidity in the wake of its post-bubble recessions, our central bank has been preventing prices to return to normal, thereby perpetuating (and exacerbating) the destructive cycles of bubbles and economy-crashing bursts.
Value of U.S. Dollar in Gold Shrinking since Abandoning Gold Standard
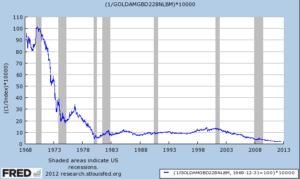
The Fed’s massive expansion of the money supply since abandoning the gold standard and adopting fiat currency has significantly devalued the Dollar.
U.S. Student Loan Default Rate Growing
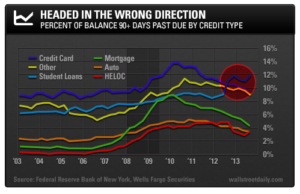
This chart demonstrates two important points: 1) The recent torrent of debt defaults occurred AFTER the housing bubble popped; the majority of mortgage defaults occurred BECAUSE of the asset price crash. 2) Although there has been some debt deleveraging since the economy bottomed in 2009, the student debt default rate continues to climb. This is, in large part, due to the scarcity of good jobs that have been available to new graduates.
U.S. Poverty Rate Growing
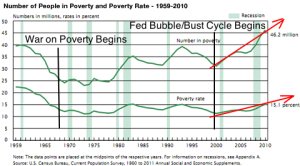
After declining steadily in the years following WWII, both the poverty rate and the aggregate number of Americans in poverty remained in a narrow corridor for decades until the Fed began its bubble/burst economic paradigm in the late 1990s. Since then, both the rate of poverty and the aggregate number of persons in poverty have been trending upward, growing sharply during the periods of post-bubble bursts and declining only slightly during the relatively-prosperous bubbles themselves.
U.S. Food Inflation High During Quantitative Easing (QE)
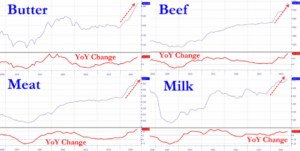
The $4 trillion the Fed has printed since the financial crisis has leaked out into the consumer economy, promoting price inflation in essentials, including food. (Source: Bloomberg)
U.S. 10 Year Treasury Rate Falling
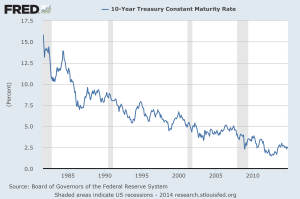
In recent decades, the Fed has been crushing-down interest rates and flooding the treasuries market, facilitating the bubble/burst economic paradigm and enabling profligate federal deficit spending. Much of the “prosperity” we’ve seen during this time has been a function of Fed-enabled debt.
Fed’s Bubble/Burst Economic Paradigm Widening Gov Revenue/Spending Gap
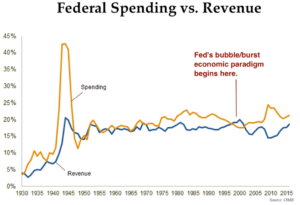
The Fed’s bubble/burst economic paradigm since the late 1990s has been widening the federal government’s revenue/spending gap. This is primarily because 1) the Fed’s massive liquidity pumping has enabled the federal government to increase deficit spending, and 2) reduced earnings growth due to a decade-and-a-half of economic instability has translated into reduced revenue growth for the federal government. Each time the economy crashes, the gap widens.
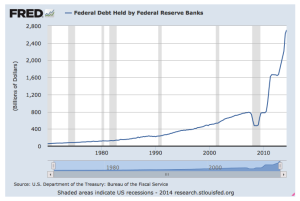
U.S. Federal Debt Held by Federal Reserve Growing Exponentially
The Fed “prints” money by buying Treasury Bonds; the purchase of T-Bonds is the purchase of federal debt. Since the financial crisis, the Fed has been attempting to “fix” the economy by significantly increasing the money supply and federal deficit spending. Prior to the abandonment of the gold standard and the subsequent creation of fiat money in 1971, the Fed held nearly zero federal debt.
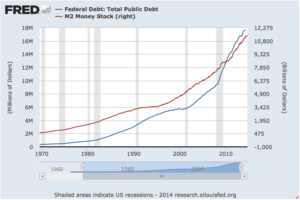
U.S. Federal Debt and Fed Money Printing Growing Proportionally
This chart demonstrates the correlation between “money printing” and increased federal debt. To “print”, the Fed, purchases federal debt in the form of Treasury Bonds. The increased purchase of federal debt enables the government to increase deficit spending. Again, the Fed held virtually zero federal debt prior to the abandonment of the gold standard and subsequent adoption of fiat currency.

